What are PROMIS Scores?
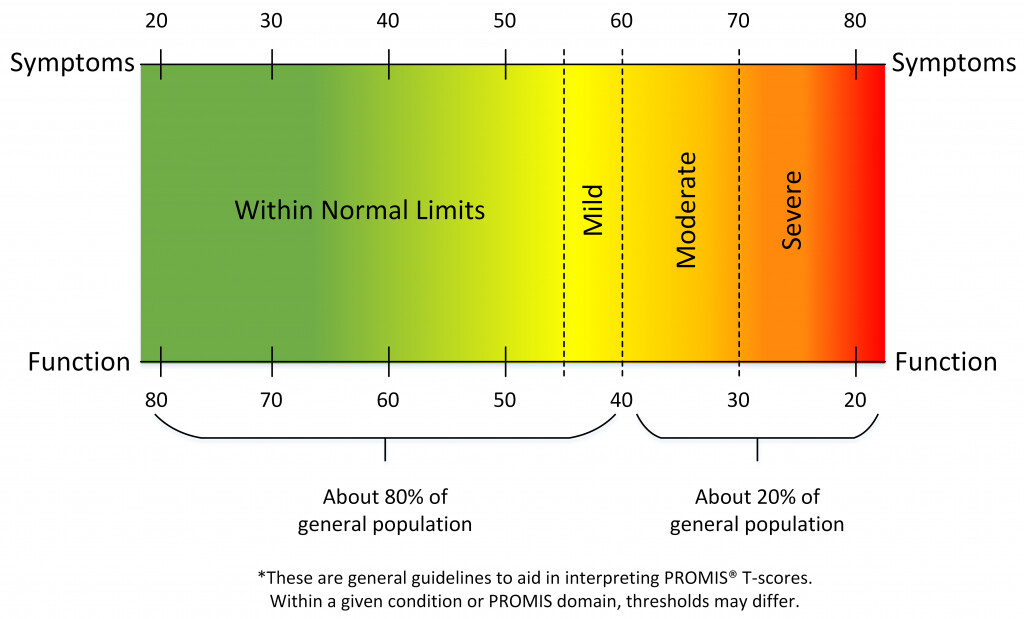
PROMIS assessments are scored on what is called a T-score metric. High scores mean more of the concept being measured. 10 points on the T-score metric is one standard deviation (SD).
PROMIS scores have a mean of 50 and standard deviation (SD) of 10 in a referent population.
- A score of 40 is one SD lower than the mean of the reference population.
- A score of 60 is one SD higher than the mean of the reference population.
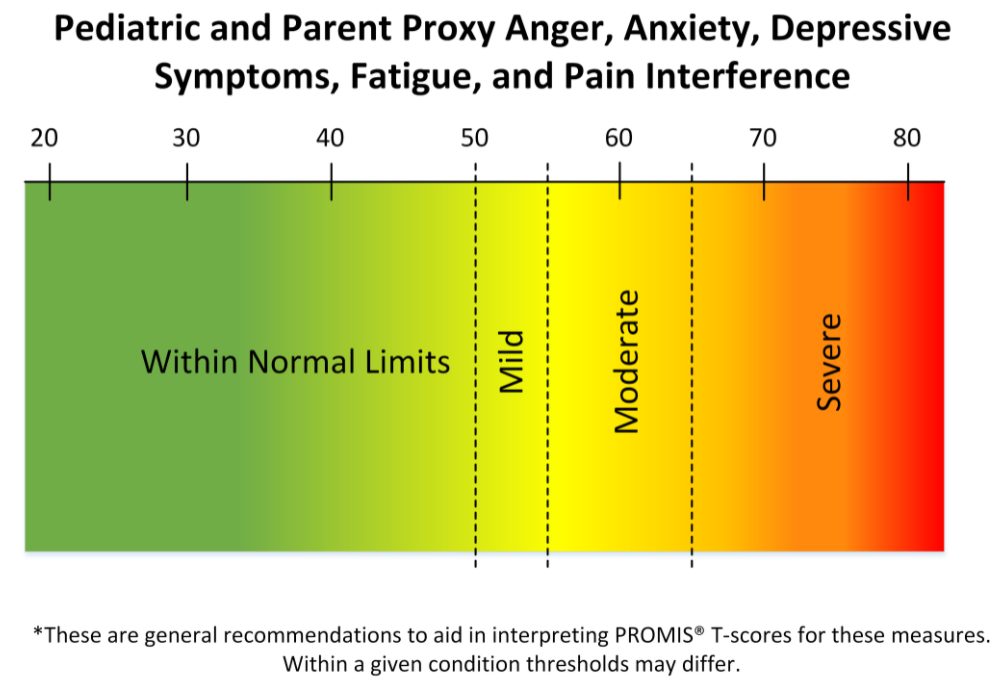
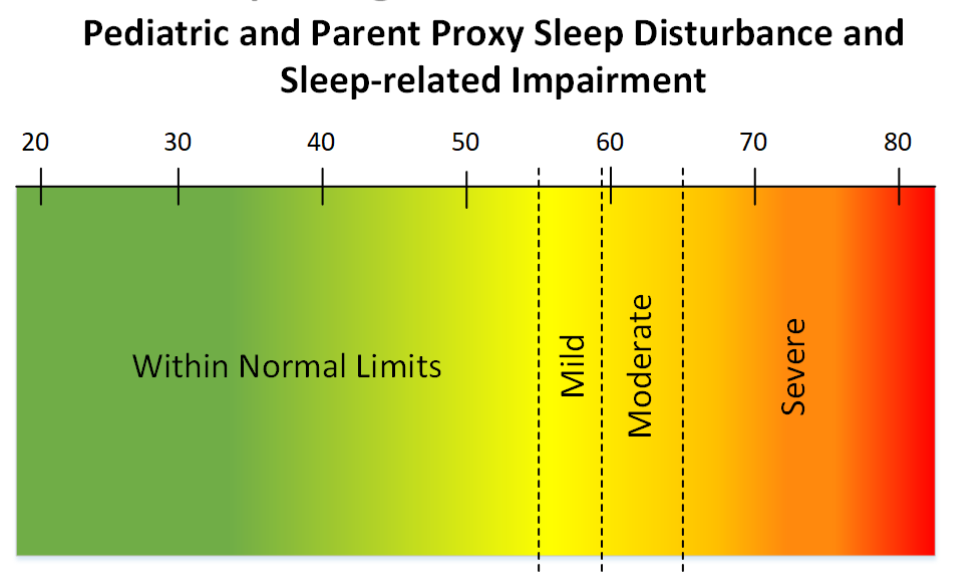
Interpretation
- Scores 0.5 – 1.0 SD worse than the mean = mild symptoms/impairment
- Scores 1.0 – 2.0 SD worse than the mean = moderate symptoms/impairment
- Scores 2.0 SD or more worse than the mean = severe symptoms/impairment
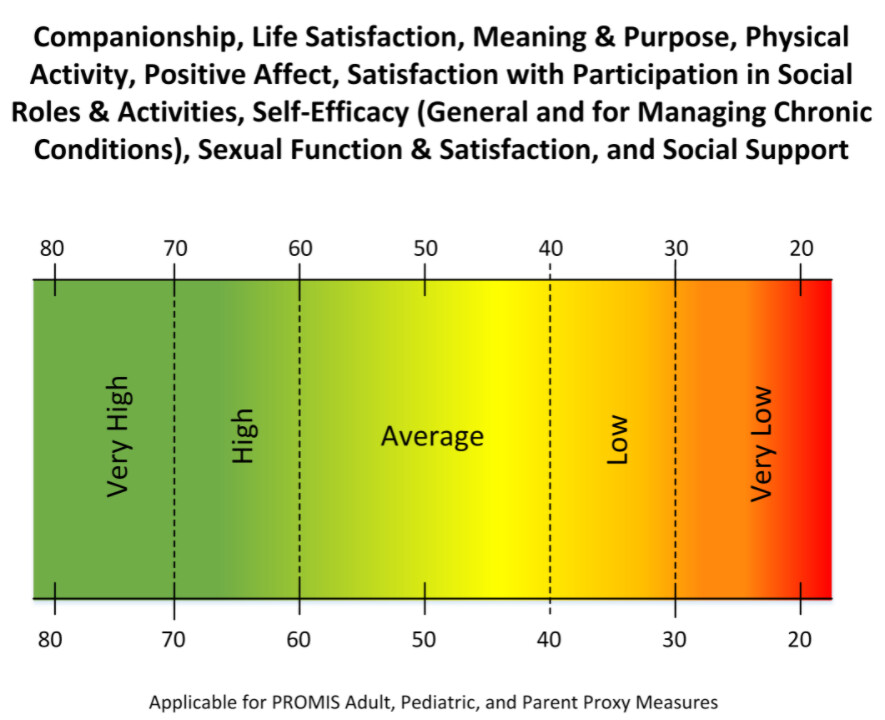
Summary
This chart visualizes the T-Scores and severity ranges for most PROMIS assessments.